Android : How to test if Android Application has memory leaks
Manual Front:
Application slowing down while using it? It gets unresponsive after a while of use? It gets a significant amount of time to load an activity?
Automation Front:
Instrumentation/Robotium test fails after a number of test methods getting executed? Automation fails on its way throwing Out Of Memory exception?
Yes , Symptoms indicate you to investigate on memory leaks with your application.
Lets understand – What is memory leak?:
When declared variables have references to some objects those have occupied memory from heap area, but those object references are no longer used or not to be used with the application anymore, at the same time it prevents GC(Garbage Collector) to release memory – We call it memory leak.
Consequences:
Application occupies memory gradually without freeing them up and when the maximum heap available is occupied , we get Out Of Memory exception – Which says user that application is unresponsive.
How to Check if application has memory leak:
What do we need?
Eclipse with ADT(Android Development Tool) installed.
Steps:
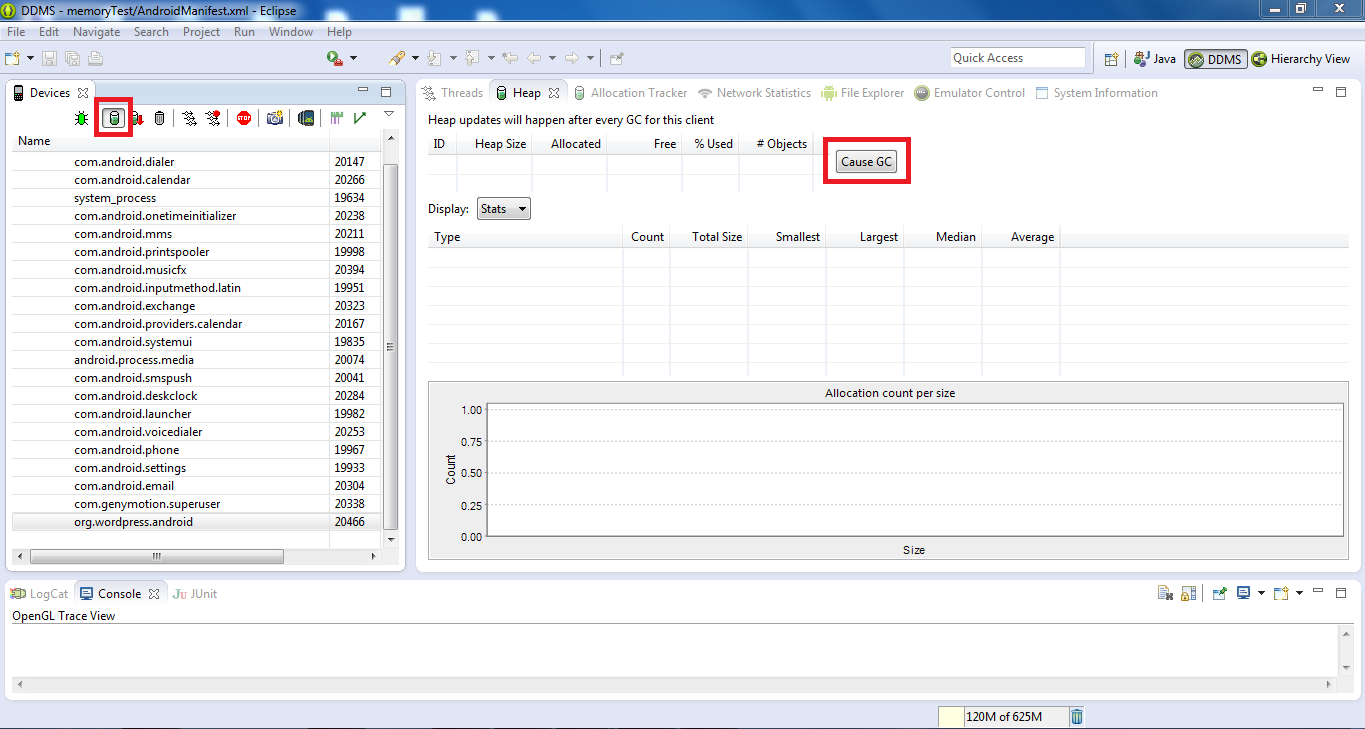
1. Open the application with an Emulator
2. In Eclipse switch to DDMS perspective.
3. From the left panel select the emulator and then select the activity of the application
4. Click on Update Heap button
5. Now Cause GC button will be Enabled – Click on it.

6. Use the application and do the stuffs which makes the application to get unresponsive, observe the “Allocated” column in DDMS.
If Allocated memory keeps on increasing – This is an indication of memory leak. You can see that when application gets unresponsive , allocated memory will be little less or equals to the maximum heap allocated to the emulator while creating it.
Analyze your application objects to narrow down which portion has the issue:
1. Click on ‘Dump HPROF file’ in the left horizontal menu and save the file .
2. Use MAT Eclipse plug in to investigate/analyze the objects and its occupancy of memory.
MAT Link: click here
Investigate memory leaks while running Instrumentation/Robotium tests:
Now we will see how we can monitor the memory usage of the application at various instances of time and states.
In android instrumentation tests/Robotium tests add the following snippet to get memory(heap) allocated to application- How much getting used and how much is free and the maximum heap memory of the device.
Log.d(“memoryTest”,” : occupied memory ++++++++++ “+Runtime.getRuntime().totalMemory());
Log.d(“memoryTest”,” : Free memory ++++++++++ “+Runtime.getRuntime().freeMemory());
Get the maximum heap that can be occupied in the current device:
Log.d(“memoryTest”,” : can be occupied memory ++++”+Runtime.getRuntime().maxMemory());
To see the Logs – LogCat can be used and by analyzing the logs at various states of the application , we can be assured about the memory leak status.
- Bring the auto Sync magic of Protractor to Selenium with Java - October 23, 2015
- Restarting Appium Server could improve various server freezing issues and may improve execution time - January 20, 2015
- Appium with iOS 8 and XCode 6 : What’s new? - November 5, 2014
- REST API automation testing using Apache HttpClient – The Approach - October 3, 2014
- An Overview of mobile application : Moving forward to automation - October 1, 2014
- An introduction to REST - September 29, 2014
- Run ChromeDriver with Chrome Driver Service to reduce script execution time significantly - September 26, 2014
- Selenium WebDriver – Get Cookies from an existing session and add those to a newly instantiated WebDriver browser instance. - September 26, 2014
- Simulate Copy Paste action using Java Robot and Clipboard class - September 26, 2014
- Android : How to test if Android Application has memory leaks - August 11, 2014


